—
Listen to the episode here:
ATA Day 3 – 1: QDMA – State Of The Whitetail
 I asked them a series of questions on numbers of bucks and does they shot, age structure of the harvest, and a whole host of other questions about what’s going on within their state, hunting-wise, management-wise and big issue-wise. We compile this all together and it goes into an annual whitetail report. I have three copies of our 2018 report. We’ve been doing these, as I said, it’s the eleventh year. The new report comes out in January of every year and our 2019 report is out now. The 2019 report is essentially what I’ve covered or the highlights of that. These are all online. These are all free downloads at QDMA.com. You can go there and get all this information in a state by state look at how your state compares to others on numbers of deer that are harvested annually, age structure, sex ratios, all kinds of information. It allows you to see kind of what’s going on in your neighborhood, in your region of the country. You can see and compare that to other regions
To set the stage here with what we’re talking about, it’s important to understand that the deer management is not a one-size-fits-all recipe. As hunters, we’d like to think that how we want and the opportunities that we have are similar to other hunters across Whitetail range. That’s not true at all. It’s very different where we are within this range. Just think about some of the different things that the deer deal with on a daily basis based on where they are, things like average daily temperature. You can take a look at the average daily temperature in February. There’s a 60-degree swing from South Florida to Northern Minnesota. Big differences on that deer verge because of that tremendous differences on the habitat that they live in with regard to the amount of food that is produced and covers produced. While you’re thinking about your funding and your state or what’s going on in other states, I’m going to show a few variables to think about how these things impact deer because these all go into the number of deer, the age structure of those deer and the opportunities that those hunters have.
There are big differences across the Whitetail’s branch in average annual precipitation, which has a huge influence on forages produced and follow that forage. Big differences on the forest. You have deer in Northern New England that will live their entire life in a mature forest. We have deer in South Texas that will never see a mature terrain throughout their whole life. You have deer in the plains that will never see a tree. Big differences and how adaptable these animals are. Certainly, that’s a big difference on what hunting opportunities we had. Somebody hunting in Northern New Hampshire has been hunting entirely differently than somebody in Western Kansas, for example. We have big differences in deer densities across the region. Some places have lots and lots of deer and in some places have very low densities. There are big differences in hunter density and this is one the hunters almost never think about. This arguably has the largest impact on what we’re shooting year in and year out in any one of these states.
 For example, what I’m saying here is the West and we had this data in an older Whitetail report, 100 densities in the state by state map. I’m going to combine them here. For example, in the West, all those states combined only average about 100 per square mile. Big wild places, beautiful landscapes, just not many people. It’s 100 per square mile. As you move east, you get into the southeast and the Midwest. They both average about 600 per square mile. Suddenly, you can start seeing some of the differences in management progress based on where you are relative to 100 density. If you get to the northeast, that jumps to 1,100 per square mile. My home state of Pennsylvania leads the country. We have over twenty hunters per square mile. Think about this, you could have the exact same deer management program in say Arizona as you do in Pennsylvania. You could have everything exactly the same, but the results would be far different simply because of the number of hunters on the landscape. As hunters, we need to think about this as we’re thinking about what they do in Michigan or how do we do this in Nebraska. It works well in Kentucky. Why wouldn’t it work at home? Make sure we take a look at the number of hunters on the ground that play into that because that explains a lot of the differences.
We also have differences in deer or subspecies of deer, whether we’re in Florida or Texas or Saskatchewan or anywhere in between. The big difference is what we could hunt. Does anybody know or has seen this on TV or known anything about this? This is Rochelle Partridge. Her husband, Dean Partridge runs Canadian Whitetail. It’s the best deer content TV show in Canada. If you watch TV at all, this is known as The Creek Buck. It does an incredible cover story. Obviously, plus 200-inch deer, 213 or 215. The story behind it is even better. If you watch TV at all, search The Creek Buck on The Canadian Whitetail. It’s a fascinating story. Let’s talk about exactly what we have in the 2019 Whitetail Report. As I said, this is online. You can go to QDMA.com and download all of this. Everything that we have following now comes straight from this report.
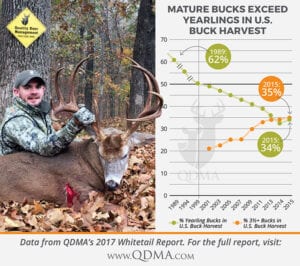
 One of the things that we monitor across the whitetail range and had been for a long time as a percentage of one and a half-year-old bucks in the buck harvest. We get every single state’s harvest data. You can take a look at this because this is a good measure of quality deer management programs and what states are doing to have good age structures of bucks versus very skewed age structures. What we found was in the 2017/18 season and all of the data that comes from this harvest data is from the 2017/18 season because that’s the most recent season that is complete and states have the data available. For example, the next season, the 18/19 season is still going on in many states. Next year’s report will include that because this season will not conclude until the end of January or February. It takes days, many months to compile the data after. The 2017/18 season take all the antlered buck shot across the whitetail’s range, 35% of them are one and a half years old. This is near the lowest national average ever reported. In fact, we’ve been monitoring this since 1989. Back then, 62% of all the buck shot was one and a half years old.
You can see how that line has changed over the years as the influence of QDMA has grown. It has influenced a whole push of QDM and hunters becoming more knowledgeable down to now it is bottled out over the last five years and about a third. That’s a pretty good place to be because of all the bucks that we shoot today. About a third of them are one and a half years old. We can take a look at this on the other end of the spectrum as well. We look at all bucks harvested that are at least three and a half years old. We combine the three and a half, four and a half, five and a half and set them all together. In that same season, 34% of them were at least three and a half. This is near the highest national average ever reported. There are some good age structures out there which relates to good hunting opportunities for us. If we take a look at this, what this means is hunters kill more bucks that are three and older than they do bucks that are two and a half. This is a very powerful statement because there’s a lot of states that this program is designed to protect antlered bucks and programs and educational pushes some agencies to do that. There are programs designed to protect two-year-old bucks. It’s just a move from one and a half to two and a half.
You have hunters saying, “We want the opportunity to hunt some older bucks.” They’re talking their talk, but this data shows they’re also walking the walk because there are no states protecting two-year-old bucks, yet hunters are willingly shifting to the large number of two-year-olds into these older age class to be able to harvest, which is pretty cool. It’s a very different experience the hunters have now on average than we did ten or twenty years ago. In fact, if we put both of these together, we take a look since 2001, the last seventeen seasons, these are the percentage of bucks that are one and a half years old. Over time, we’ve come down over a few years. We’re down at about a third. I’m going to show you the percentage of bucks at three and older. Back in 2000, there’s only about 20%. For every one buck we killed that was at least three, we kill two and a half that was just one. Watch how this has changed over time. The three and older are growing. It’s about equal now.
Think about it. For those of you that have been hunting longer, there are many folks in here that have been hunting a lot longer than that, think how different experiences we have now and the opportunities we have now compared back to this shift in age structure. In almost all of this was hunter driven and almost all of it was based on educational programs that hunters are learning the benefits of not shooting every year-old buck. They hunt more three up. It inhabits more deer opportunities. It’s pretty cool. It certainly makes for some great trail camera opportunities and some phenomenal hunting opportunities. Let’s take a look at harvest numbers. We break all of our data in our report state by state and province. For this, I’m going to combine the groups because they simply can’t show all the state stuff.
The three main groups I’m going to talk about are the northeast, the Midwest, and the southeast. The reason for that is if you draw a line right down the Rocky Mountains, everything east of that makes up those three regions consists of about 97% of all the whitetails in the US and about 97% of all the hunters in the US. That is the snapshot of exactly what’s going on in the vast majority of the whitetails world. We have data from the West on this. A lot of western states, their harvest combined whitetails and other deer together, they’re not able to separate them. The report includes information of what I’m going to share with you next from these three main regions of the whitetails range. From antlered buck, those three regions shot over 2.8 million antlered deer. This was up 2% from the year before. There’s an important caveat here is that it says the state of Alabama still does not have all of their deer harvest data from two hunting seasons ago. This is not a knock on Alabama’s DNR. They use Responsive Management, which is one of the top natural resource survey companies in the country to survey hunters to provide this. A lot of agencies do that. That was all done. The data came back. There was an error in the data, a few errors in data. The data has gone back to Responsible Management.
 Alabama hasn’t received the results yet. What this means is all the other year’s data includes Alabama data. Even without them this past season, buck harvest still increased, which is pretty cool. If we take a look at what’s going on in the last ten hunting seasons with bucks, you can see the antlered buck harvest was down going a little bit. Here’s what’s happened in the last three years. This is a big deal. We go back to some pretty historic highs with regard to numbers of bucks that we’re killing. All of this data and includes Alabama. This one does not include Alabama, but Alabama typically shoots about 100,000 bucks a year. This likely is even higher. This is a pretty big deal in what’s going on in whitetail world. Who do you think kills more bucks than anybody else? Which state? Rhode Island. Texas kills more bucks than anybody else, but they should. It’s the biggest state in the lower 48. There are a lot of deer hunters. There are a lot of deer. The thing that’s amazing about this is it more than doubled the second state. That’s a sheer scale. Look at how many bucks they kill annually in Texas.
We always take a look at who shoots the most because hunters want to know that. That’s not an apples-to-apples comparison. We also take a look at this as who killed the most bucks per square mile. We can measure it a little bit better, apples to apples with all those states. Texas does not lead this. In fact, Michigan typically leads year in and year out who killed more bucks per square mile than any other state. This is an extremely high harvest for them. Is that all that high? That’s really high. That’s a lot of deer. There are a lot of deer hunters in Michigan. It’s a big deer hunting culture. They killed a lot of bucks. We also take a look at this one in more different ways because we can look at per square mile, which is cool. How about if we look at who kills the most for every 100 deer hunters?
Reality is very different from perception. Share on XYou always start comparing it on actual numbers of deer hunters in these different states. What we found here is actually Texas comes back around on top. Think about this, for every 100 deer hunters in Texas, they killed 69 bucks. That is an astounding harvest rate. Even these other states out of here, these are states that are whacking bucks. There’s a lot of good hunting going on here. Let’s take a look at the antlerless harvest. Those same two regions shot over 2.8 million antlerless deer. This was within a percentage point from the year before. Again with no Alabama data, but the scene here is very different. This is the same ten-year period I showed you for bucks. This is what’s going on from 2008 to 2014. It’s pretty similar with what we saw with buck harvest.
Remember the last few years, the buck harvest has been skyrocketing. Here’s what’s happened in the antlerless side. It is plummeting. In fact, from 2008 until now, it has dropped 18%. That is a difference of 120 million venison meals. Think about that. 120 million meals lost during this time period because of this reduced antlerless harvest. There are a lot of reasons for this. Some states had been aggressively harvesting antlerless deer back in here and have not balanced deer herds with the habitat, so there’s not a need to shoot as many antlerless deer. That is one of the reasons in some states. Some states, particularly in the southeast, they had a lot of coyotes move in and predation rates have skyrocketed. Farm recuperate rates have plummeted. They just simply don’t have the deer herd landscape anymore and they have dramatically reduced antlerless harvest opportunities because they simply don’t have the base to do to support that market standard or is habitat loss. There are a lot of things that go into this.
It’s wise to say across the whitetails range, this is a big deal and a very different look from what we’re seeing during the past decade. What do you think shoots the most antlerless deer in the past decade? Do you think Texas leads this one? Texas never leads this except they did this year, so 2017 was a tremendous year in Texas. They actually led the country in antlerless harvest as well. However, we do the same thing. We look at our first go around. They weren’t even close under the per square ball base. Maryland is the perennial leader here. Year in and year out, Maryland shoots more deer per square mile total bucks and does than any state the country, which is amazing if you think about Maryland, all the whole western half of the state is very mountainous. It’s very similar to West Virginia or parts of Pennsylvania.
Certainly the eastern half, we think of the Midwest with all of their agriculture and tremendous growing conditions but the western half is very different. The fact that they shoot this many deer, there’s a tremendous number of deer going into freezers in Maryland. We can take a look at that, antlerless harvest with regard to numbers dropped from 100 deer hunters as well. Maryland comes out of here. Think about this. For every 100 deer hunters in Maryland, they shoot 93 antlerless deer. That’s a pretty high harvest. That’s a fun place to go deer hunting. If we put those both together, combined bucks and does, we shot over 5.7 million whitetails which provided a tremendous recreational opportunity for hunters, billions to our economy essentially funded all of these wildlife management programs and provided over 1.1 billion wholesome meals. This is something that we don’t talk about nearly enough. I’m guessing all of you deer hunt, all of you eat venison, all of you share venison with friends and family. How many of you talked about that or tell people, “Yes, we did this. We shared this?”
As hunters, we need to do that more because as hunters, we’re a distinct minority. Only about 4% of the US population buys a hunting license. We don’t get to hunt because 4% buy a license. We get to hunt because about three-quarters of the American public support hunting. It supports legal, ethical regulated hunting. The better job we can do as hunters to project a positive public image, the more likely it is that the non-hunting public will continue to accept what we do and support us. This is a great way to be accepted. “I shared venison. I shared meals with Navy families and with my church, with the groups, with the school,” or whatever. As hunters, I challenge you. Make sure that you share some venison this year with friends or family. I want you to encourage others to do the same. In QDMA, we have two big five-year goals that are related around us.
One is in the next five years, QDMA members are going to share twenty million venison meals. These are prepared meals. I’ll invite Bruce and his family over. I’m cooking venison that I’m sharing. Our encouraged number is twenty million meals. We are also going to donate 40 million venison meals where I’m giving him some hamburger. I’m giving him some steak or I’m donating the deer. I’m dropping the deer off or I’m paying for deer process. Think about that, twenty million meals we’re going to share, just QDMA members. 40 million meals, we’re going to donate. Please help us with that. Do whatever you can in your community with it. Encourage others to do it. This is great for future planning. We picked up ten of the current national issues that are big in whitetails world and will share this information with you to give you a national perspective of exactly what’s going on.
One of them is that we know how many deer are being shot. How do they get shot? What percentage of all of the deer hunters do you think they’ve taken fires? Is it a quarter percent? Is it a half percent? Is it three quarters? It’s about two thirds. Nationally, about two of every three deer shot were shot with a rifle or shot. The thing here is that the archery part, muzzleloaders that has the bow hunters jumped. Fifteen years ago, only 50% of the deer were taken with the archery. Now it’s up to 23%. We can use crossbows. The last stage we used to. We have a lot more expanded archery season, a lot more expanded opportunity so we’re trying to get people into the system, which is a good thing. That number jumped quite appreciably in the last decade and a half.
 We also take a look at when these deer were shot. What percentage of all the deer shot were shot free firearms when there’s still a whole bunch of green grass out here and everything’s grown? We’ll take a look at this. Nationally, over a quarter of the deer or 26% of all the deer shot during the 2017 season were in the freezer before the first day of that state’s primary firearm season opened up. There’s a lot of expanding opportunity the early seasons are going up. The northeast as a region shoots the most before firearm season starts. A third of the deer are already in. New Jersey led the nation. Over half of all the deer killed in New Jersey are dead before the opening day of the shotgun season starts. This is very different than in the past. The state is making a concerted effort to provide more opportunities, especially early opportunities. The weather is nicer, maybe get kids out more or whatever. They’re trying to take advantage of longer seasons to do this. How about opening day? I’m from Pennsylvania where opening day is arguably the biggest day of the year. These guys are from Michigan. It’s the same with them. What about opening day? Was your opening day heavy, hot and intense or not so much?
What we found is across the country about 110 deer gets shot at opening day, the state’s primary season. This is the north and the south. If you’re in the south where it’s a very long season, opening day effect tends to be way less. If you’re in the north where you have very short intense seasons, opening day is bigger than Christmas. The Midwest actually shoots the most on opening day with about 16%. In fact, Minnesota, led the country with over a quarter of all their deer being killed on one day. If you want to be someplace that’s fun and intense and exciting, it’s electricity in the air. That is the place to be, opening day in Minnesota’s primary firearm season. We can’t come to a bow show and not talk about bowhunter numbers. Does anybody have any idea how many bowhunters there are in the United States? There are about three million bowhunters. The Midwest has the majority of them, with regard to taking a look at those regions. It’s greater than 1.3 million. However, the northeast has the most per square mile. It’s almost four bowhunters per square mile. What’s amazing about this is early on when I said hunter density, it has such a big influence or impact on the deer harvest. How many of you would like to go to Iowa to deer hunt?
How many of you recognize that Iowa is a good deer hunting state? Iowa and whitetails go hand in hand. Iowa averages less than 500 per square mile. In addition to good growing conditions, agriculture and all of that, one of the things that allow them to do what they do is they don’t have that many hunters. It’s not from the lack of desire. They’re strict and is able to come in particularly bowhunting. Iowa averages less than 500 per square mile total. The northeast adds about that many bowhunters per square mile. Then you add all the rifle and shotgun hunters on top. It’s a big difference there. Pennsylvania has more bowhunters and more bowhunters per square mile than any other state in the country. There are lots of opportunity in Pennsylvania.
Let’s talk about successful hunters. Many states have expanded limits. Many hunters think we can kill X number of does or bucks. “We would kill all the deer. They are all going to be gone.” Georgia is a perfect example. If you buy a deer license in George, you get two bucks and ten antlerless deer that you can shoot. If everybody kills ten antlerless deer, all the deer would be gone. The reality is if everybody did kill ten antlerless, they probably would, but that doesn’t happen. What we found was that if you take a look at this across the whitetail’s range, 41% of all hunters shot a deer in 2017. Nearly half of everybody, which is pretty good. That’s a pretty high success rate. This range from 12% in Arizona to 69% in South Carolina. Nearly three-quarters of all their hunters got to shoot at least one deer. That’s a pretty high harvest rate. A lot of deer. A lot of opportunities go into that. Arizona, very restricted opportunities are what really plays into that. This is down a little bit.
We asked the same question back in 2011 and in that year, 48% of all the hunters in the US shot a deer. Hunter success slipped a little bit, but we also asked what percentage of your hunters shoot more than one in one day. This goes back to everybody can kill ten deer. What we found out is that only 15% of all the hunters in the country killed more than one deer in 2017. Probably everybody in here shot more than one deer that year. We are in the minority with this. In my example about Georgia, buying a license, you get ten antlerless opportunities and two bucks. The thing is in Georgia, less than half the hunters even killed one deer throughout the year. The reality is very different from perception with regards to many hunters on what their state is or how many deer folks can kill.
Let’s take a look at how many days people actually spend in the field deer hunting. I’m sure you probably have some idea that it was going five or ten or twenty or 50 or what was it last year. In 2017, hunters average twelve days hunting deer. Southeast hunters average the most. I think this really parlays into they have in many cases a longer season. They have the most opportunity to spend time in the field. This ranges from hunting deer three days a year in Indiana to 25 in Mississippi. I don’t know how hardcore of deer hunters you are, but I’m guessing if you’re here 7:00 on Saturday morning, you’re probably pretty hardcore deer hunter. I can’t even imagine hunting deer three days a year being done. If I don’t get three days in opening week, I’m getting a little nervous if you know what I’m missing that.
This is a reality so across the state in Indiana, all the deer hunters average three deers. They have shorter seasons, different opportunities. The big difference is this is a fun table look at in the report just to see where or how you compare to one of your state heads. Deer vehicle access are a big deal. They certainly impact all of us with regard to what we pay for truck insurance rates. In the US according to State Farm Insurance which compiles this from July 2017 to June 18, this one-year block, we hit over 1.3 million deer on the road. That’s a lot of whitetails hit. The Midwest hit the most as a region. They hit nearly 500,000 whitetails. The northeast, it’s the most per road mile. We hit 0.35 for every one mile of road. When I think about this, think about the personal safety factor to us. Waste of the resource because most of these deer don’t go to somebody’s.
We end up paying more for insurance to cover all of this. This is a big deal. My home state unfortunately led this and hit over 140,000 deer. It hit one for every half a mile of road. It’s not good. That’s one of the reasons that Pennsylvania has the highest insurance rates in the country with regard to vehicle insurance. Let’s talk about urine. It’s become a bigger, bigger deal where states outlaw the ability of hunters to use natural urine from deer or elk because of CWB concerns and some of the threats. There are eight states now and one province that do not allow urine anywhere in the state, natural urine to be used by hunters. There are a handful of other states like Pennsylvania, Michigan, Minnesota that don’t allow in the disease. This is becoming a big topic. There were talks on this here. A lot of discussions are going on the professional community on the exact risk of urine analysis.
We show this here to show you that there’s a lot of discussion at the State Wildlife Agency and a lot of hunters being impacted in this discussion is only going to get bigger. What about tracking dogs? Can you use a dog in your state to track? It wasn’t all that long ago there are many states that just simply didn’t allow. Unfortunately, about 75% of states and everybody agreed allows you to track wounded big game with a dog. The states that you see in stars here means that this dog has to be on a leash while you’re tracking. You at least had the opportunity and this is good. As hunters, we should have every tool available to us to do everything morally and ethically responsible to retrieve a deer or a bear or big game that we have hit so the owners can certainly help from his perspective. It’s nice to see a lot more states here in green than there were just a handful of years ago.
The last issue we’re going to talk about then is disease because this impacts as many hunters as anything else that we’re talking about here. There were some pretty big headlines that happened last year. What we know hemorrhagic disease was confirmed in the free range in fourteen different states. If you take a look here, these are the states, these are all across the north, east, south, and west. I vividly remember being a student at Penn State University back in the late ‘80s and early ‘90s. When we got to the hemorrhagic disease discussion, our professor literally said, “This is a disease of a deer in the southeastern US. Next page.” That was all we learned about it because it essentially was not in the north. That’s very different now. We deal with it every year. In fact, in 2018 for the first time it was in Ontario. It is from Florida, Ontario, west to Montana. Everybody gets impacted at some point about this. 2018 was a relatively quiet year for most of these states. It was pretty late. Pennsylvania was actually one of the worst hit states in the southeastern part of the state. It’s certainly not what we saw in 2007, 2012 where we had almost back to back from the hemorrhagic disease.
Bovine tuberculosis continues to be a threat, particularly for the folks in Michigan. Luckily, Indiana and Minnesota have dealt with this over the last few years, so no case at all. Still contended this in the northeastern lower peninsula of Michigan and an additional pause again, which directly affects a bunch of hunters in an area. A couple of tech-related things are pretty important. We now have this Asian Longhorn tick in the United States. It showed up about a year ago and by the end of 2018 was confirmed at eight different states. There are new tick species that as hunters we’re dealing with. In Africa, this is the red meat allergy carried by ticks. That means if you get this, you simply cannot eat any red meat at all and continues to increase. This is one of the scariest things out there for anybody for deer hunters who spends time in the field and is in and around ticks. Close to home, our CEO, Brian Murphy, and his best hug buddy in Georgia hunt together and is afflicted by this. He can no longer eat any of the venison that he shoots or be around it. It’s a very serious allergy.
Let’s talk about the CWD, chronic wasting disease, which everybody here understands the difference between CWD and hemorrhagic disease. This is now in 26 states with Tennessee being the newest state. Over half of the country now has this. Some of the research where we show the important things about this. There’s a lot of misinformation out there with this, but the two big things hunters need to know are one, research shows that CWD-positive deer died three times the rate of deer that don’t have because you often will say, “You don’t see a sick deer. We’re not finding a sick deer. Is this really that big of a deal?” It is because those deer are dying. What happens in most cases is they die at the face or the hands of predators or vehicle accidents or something else before the disease fully runs its course. We see them all sickly and dead.
 If I tell you, a deer in the area, some deer are dying three times the rate of other beer. Does that sound like a positive thing for your future? Have an opportunity not about. This is exactly what’s happening in the world of CWD. It’s killing them. It’s almost like a silent killer because we don’t see it in many cases, but this is a very unnatural death rate that these deer is trying to deal with. We also know that CWD positive deer are less active than CWD negative deer. From a hunting manual, when you go hunting, are you hoping that all the deer in your area are not active? “I’m going to give you hope the deer are not active when I go out hunting.” We don’t mind that at all. We want them on their feet moving like crazy. A deer that has CWD, even when they don’t show any signs, move in a much lower rate. That’s not good at all. This is not good for the future of deer herds. This is not good for any day that we go deer hunting. Those are two of the big things that CWD negatively impacts. The two best things that we can do as hunters to slow the spread of CWD and allow the science to catch up and find a cure for this are stop moving live deer and stop moving the high-risk parts of harvested deer. Those are the two ways by far will be moved as more than anything else.
 If we could do these two things, we could dramatically slow the spread of this disease until we can figure out some way to beat it. If you want more information, QDMA has #FightCWDCampaign where we provide all kinds of information for hunters. “Here’s what the facts show.” This is not a fear marketing thing by any means. It’s just good information to share with hunters. Things that you can do to help in your community slowly spread and helping this back. We’re going to end them with a couple of fun slides looking at deer harvest statistics because we take a look at all the deer being shot and see who shoots for of them with a bow than anybody else. Any state total deer harvest like which day shoots the highest percentage of their total deer harvest with archery? New Jersey. New Jersey shoots almost 60% of their deer with a bow. Think about this, New Jersey is the most urbanized state in the country. There’s a lot of deer. There’s a lot of deer hunting opportunities. There’s a lot of firearm ordinance zones. There’s a lot of places you simply can’t use a rifle or shotgun or even a muzzleloader, so lots and lots of deer.
The only way you can kill them is with a bow. Year in and year out, New Jersey kills more deer with a bow than anybody else. How about muzzleloaders? Who shoots a higher percentage of deer with a muzzleloader than anybody else? Kentucky, because they developed the Kentucky long rifle. Is that true? That’s true. It’s Rhode Island, 42% and actually, I have a good conversation with Rhode Island’s deer biologist about this sensation. I’m like, “What exactly is it like what drives this?” He said what happens is hunters in his state have a better opportunity to shoot antlerless deer with muzzleloader than a firearm because muzzleloader season comes in prior to a primary firearm season.
It is much more lenient with regard to what they can do. This is simply the best opportunity other than the bow to shoot antlerless deer in Rhode Island and hunters take big advantage of it. How about with a rifle? Who kills the highest percentage of deer with a rifle? This will be the anti-ATA folks. It’s not Pennsylvania. It’s actually Idaho. We can go out west with this. It’s a big space where they’re shooting long range. It’s Idaho, Wyoming. The neat thing here is actually this top list, there are states from all over the country. We have some western states. Nebraska is in there. We have Midwest, southeast. We have northeast. We had northern plains. Southwest, a little bit of everything. This goes to show the diversity of habitats and opportunities that deer hunters have and the opportunity and diversity of ways that you’re taking advantage of. It’s pretty fitting the final slide here literally have states from every region in the whitetails range.
The top western states, that’s mule deer and whitetail.
Some of those are whitetails. Some are mule deer and whitetail combined. That’s correct. All of that data that I showed you is in that whitetail report. Here are all the other whitetail reports that we have. As I said these are all available free downloads at QDMA.com. You can go and grab it. I literally had every one of these printed it on my desk and I use it on a regular basis. I will say this, if you have gone and look at these, we are in process of compiling an index that lists that subjects in all of these five group orders. That will be on our website to make it very easy to go back and search any topic whether you’re looking for. We’re compiling an index to cover all of these that will be online as well.
Important Links:
- 2018 report – Whitetail Report 2018
- 2019 report – Whitetail Report 2019
- QDMA.com
- The Creek Buck
- Responsive Management
- Canadian Whitetail
- https://www.QDMA.com/buck-harvest-up-doe-harvest-down-whitetail-report-2019/
- https://www.QDMA.com/about/
About QDMA
 Kip Adams is a certified wildlife biologist and QDMA’s Director of Education and Outreach. Kip received his B.S. in Wildlife and Fisheries Science from the Pennsylvania State University and his M.S. in Wildlife from the University of New Hampshire.
He worked as a wildlife biologist for the Florida Game and Fish Commission for four years and as the New Hampshire Fish and Game Department’s deer and bear project leader for two years prior to his employment with QDMA in 2002.
Kip writes the Whitetail Wisdom column for Quality Whitetails, has authored chapters in four books, has given over 400 presentations on deer and habitat management, and has provided whitetail content for numerous television shows including Whitetail Properties, Quality Whitetails, Scentblocker’s Most Wanted, Whitetail Slam and others.
